Caractéristiques

Planifier les livraisons en toute simplicité

L'automatisation est indispensable pour vos opérations quotidiennes. Découvrez les outils intuitifs de Dropon pour générer, optimiser et expédier des itinéraires en un clin d'œil.

Caractéristiques

Planifier les livraisons en toute simplicité

L'automatisation est indispensable pour vos opérations quotidiennes. Découvrez les outils intuitifs de Dropon pour générer, optimiser et expédier des itinéraires en un clin d'œil.
User interface of a route planning software showing a trip with driver David Smith and vehicle details on the left, trip assignment details including recipient Olivia Brooks and location on the middle-left, a list of stops with recipient names and addresses in the middle, creation of a new optimized route with options to reset or cancel in the middle-right, and summarized selected stops with items and statuses on the right.
new feature

Algorithme de routage avancé

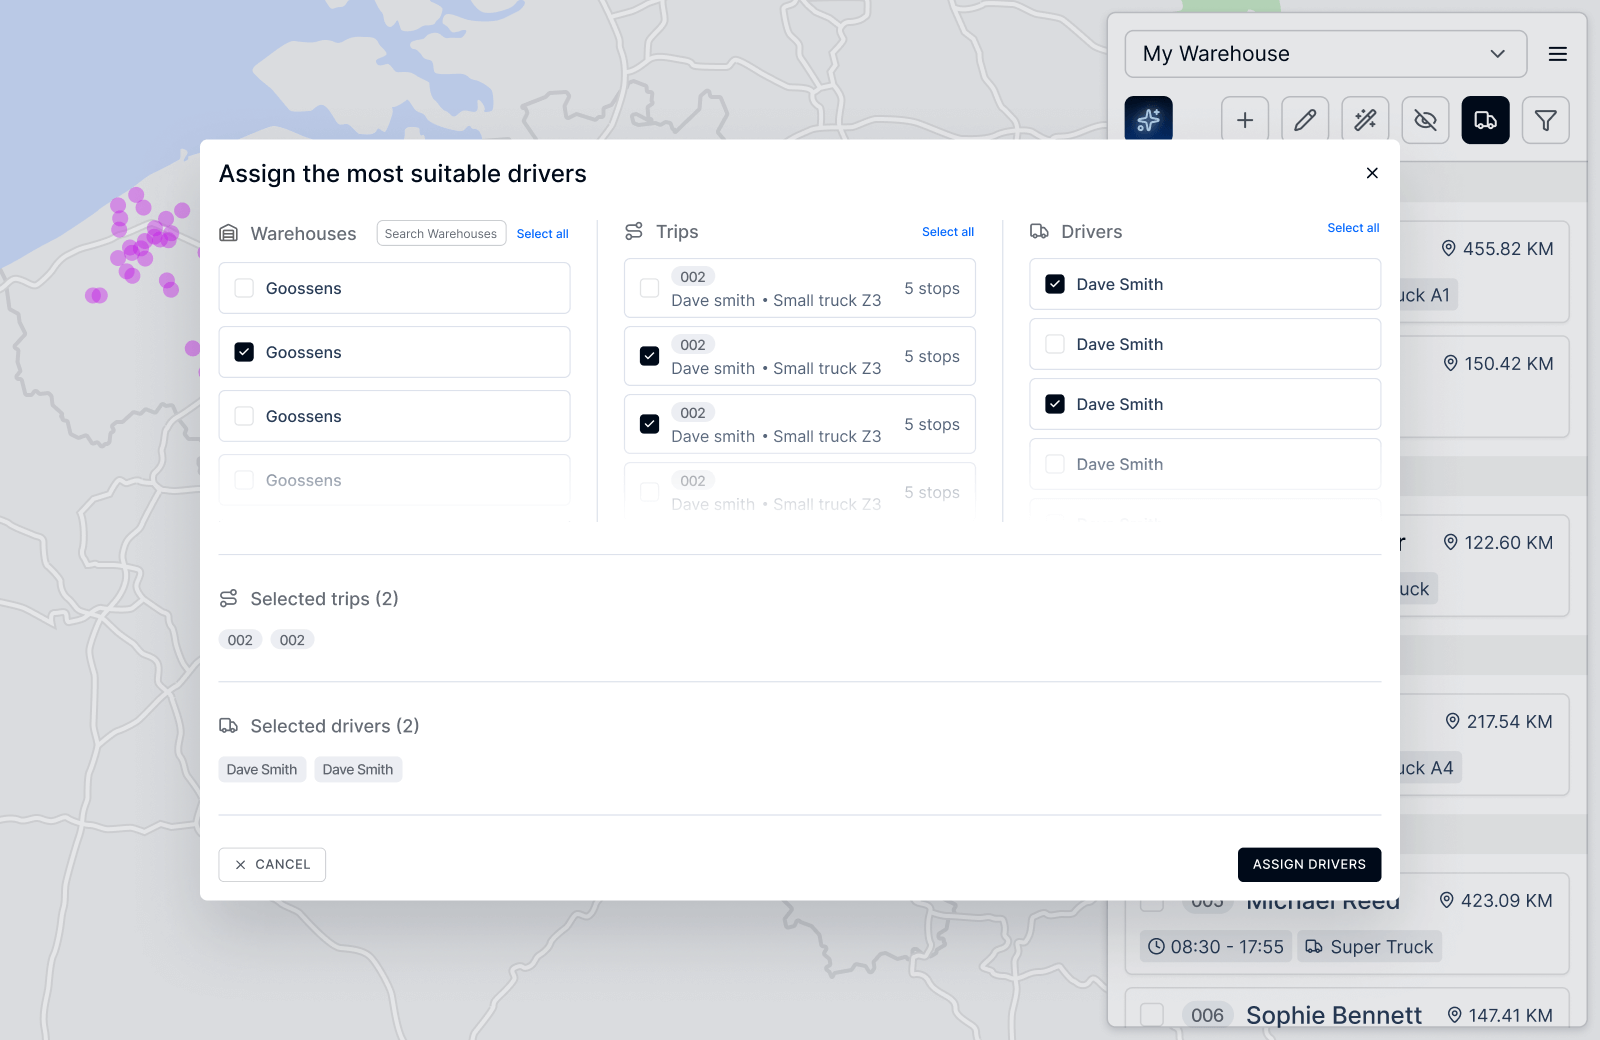
Dropon’s smart routing now goes further — with AI Driver Assignment, each delivery is matched not just to the best route, but also to the best driver.

Plan avec données de trafic historiques
Ajuster après optimisation
Incluez toutes les contraintes telles que les capacités, les fenêtres horaires, les temps de conduite, les étiquettes, etc.
User interface window titled 'Assign the most suitable drivers' showing three columns for selecting Warehouses, Trips, and Drivers with checkboxes. Warehouses column lists 'Goossens' four times with one selected, Trips column has multiple entries labeled '002 Dave smith Small truck Z3 5 stops' with two selected, and Drivers column lists 'Dave Smith' multiple times with two selected. Below are summaries of selected trips (2) and drivers (2) with tags showing '002' and 'Dave Smith'. Buttons for 'Cancel' and 'Assign Drivers' are at the bottom.
Map interface showing a delivery route with 12 selected stops, highlighted in blue, alongside driver schedules for the week.
Planifiez en un clin d'œil

Outils de planification intelligents

Outils d'automatisation faciles à utiliser
Planifiez des itinéraires dynamiques ou fixes
Effectuez des ajustements de dernière minute
Facile à personnaliser

Algorithme de routage avancé

Planifiez avec les données de trafic historiques
Affinez après optimisation
Incluez toutes les contraintes telles que les capacités, les fenêtres horaires, les temps de conduite, les tags et autres.
Diagram showing parameters used in route optimization. Vehicle Parameters include Cost, Speed, Shift, and Tags. Delivery Parameters include Time windows, Size, Tags, and Service time. These connect to General Parameters: Minimize vehicles, Deliver as fast as possible, and Balance amongst drivers. These feed into an icon leading to Optimized Routes.
Smartphone screen showing a delivery tracking app with details for David Smith at Veldstraat 1, 9000 Ghent; status is 'Stop is completed' with delivery ID DR49098024 marked completed, scheduled time 13:10, ETA 13:14, and completed time 13:12; options to add comment or picture; lists items labeled 'Box' for drop and 'New box' for pickup, with buttons to abort or complete the delivery.
Sophistiqué et simpliste

Application pour les conducteurs toujours connectés

Facile à utiliser
Mises à jour en
Améliorer la communication et la traçabilité
Ne perdez jamais de vue vos livraisons

Surveillez vos livraisons

Surveillez vos opérations avec précision
Vérifiez ce qui ne va pas
Résolvez les problèmes de manière proactive
Dashboard displaying trip statuses: 23 completed, 12 in progress, 3 delayed, 2 aborted, with actions required for two drivers.
Map showing a delivery route with a blue line from a start location marked by a navigation arrow to an endpoint marked by a location pin. A sidebar displays delivery status updates with a driver photo named David and messages indicating he is on his way, expected in 16 minutes, with prior updates labeled 2 hours ago, a day ago, and 2 days ago.
Améliorez votre expérience client

Suivi précis et notifications automatisées

Sachez où se trouvent vos conducteurs
Tenez vos clients informés grâce aux notifications ETA
Fournir un suivi et une traçabilité en temps réel
Découvrez ce qui peut être amélioré

Gardez un œil sur vos KPI

Sachez ce qui s'est bien passé et ce que vous pouvez améliorer
Disposer des bonnes données à rapporter
Maintenez votre gestion à jour
Dashboard showing logistics metrics including total stops (52), trips (2), average stops per trip (43), average stops per hour (9), and average trip duration (4 hours 32 minutes). Bar charts display stops per status and trips per status over June, July, and August 2025 with categories color-coded. Three pie charts represent planning performance, delivery performance, and driver performance with segments in different colors.
En savoir plus sur notre logiciel
DISCOVER OUR FEATURES
Prêt à livrer plus intelligemment ?
GET A FREE TRIAL