Features

Planning Deliveries Made Easy

Automation is indispensable for your daily operations. Discover Dropon’s intuitive tools to generate, optimize and dispatch routes in a heartbeat.

Features

Planning Deliveries Made Easy

Automation is indispensable for your daily operations. Discover Dropon’s intuitive tools to generate, optimize and dispatch routes in a heartbeat.
User interface of a route planning software showing a trip with driver David Smith and vehicle details on the left, trip assignment details including recipient Olivia Brooks and location on the middle-left, a list of stops with recipient names and addresses in the middle, creation of a new optimized route with options to reset or cancel in the middle-right, and summarized selected stops with items and statuses on the right.
new feature

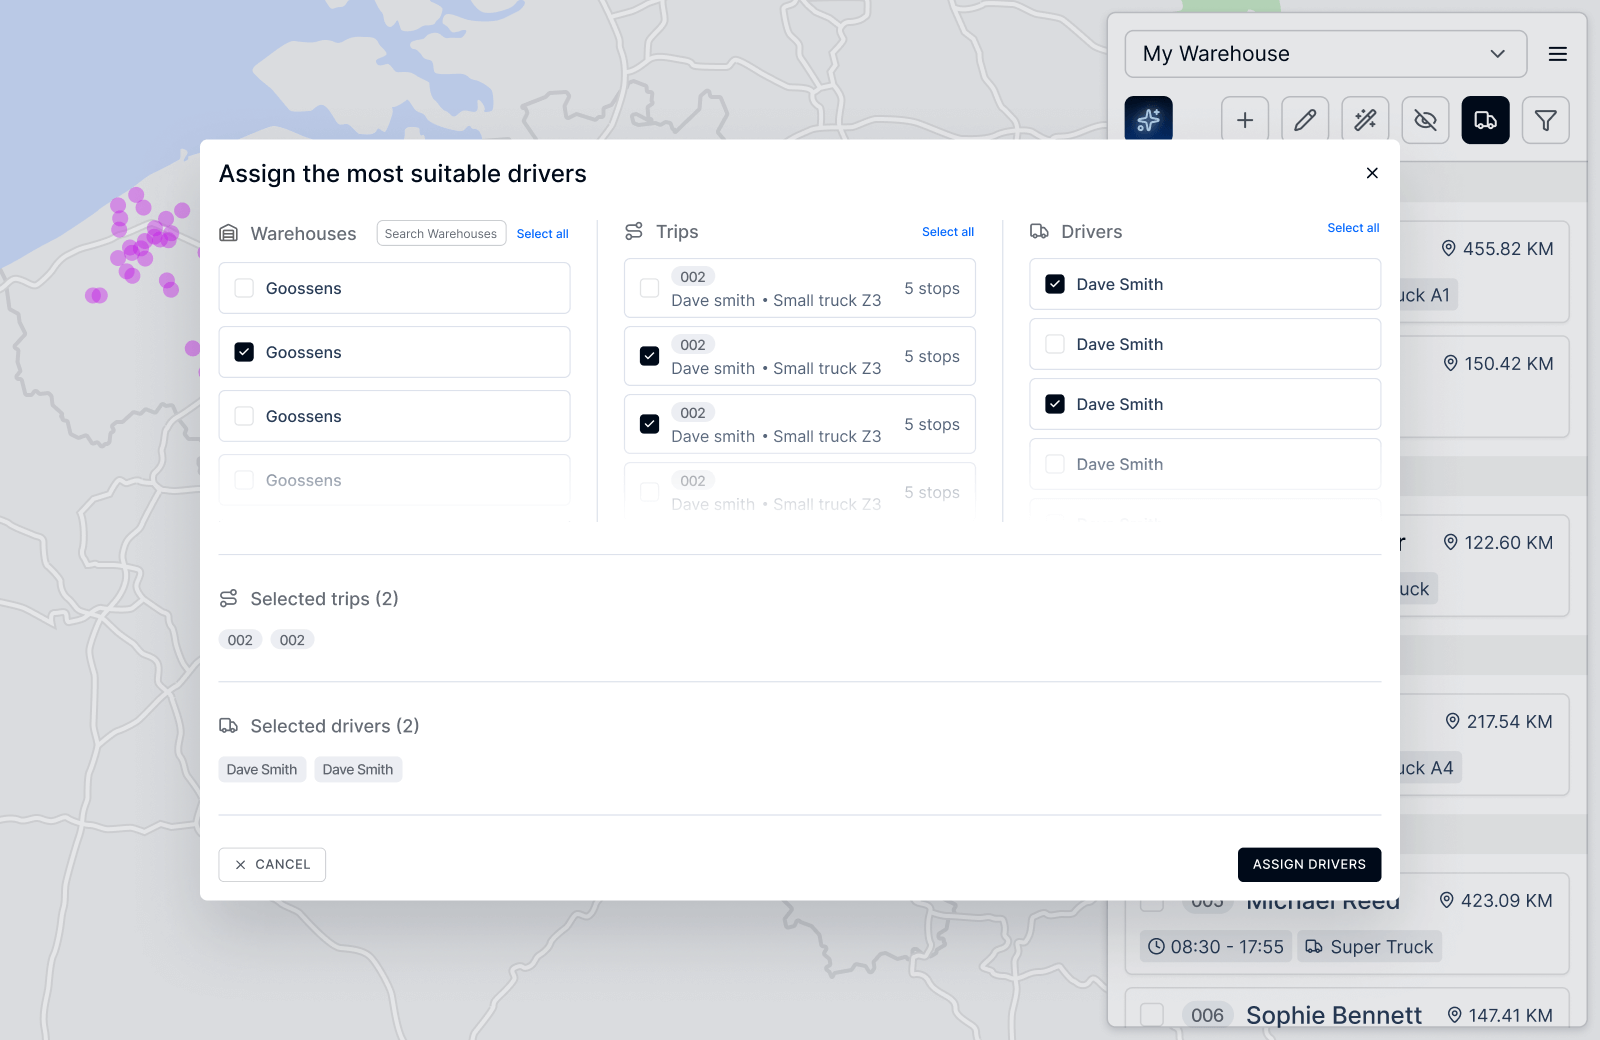
AI Driver Assignment

Dropon’s smart routing now goes further — with AI Driver Assignment, each delivery is matched not just to the best route, but also to the best driver.

Analyzes driver history & local knowledge of their region
Finds trips with highest overlap of places they’ve been before
Assigns the customer’s most familiar driver for trust and consistency
User interface window titled 'Assign the most suitable drivers' showing three columns for selecting Warehouses, Trips, and Drivers with checkboxes. Warehouses column lists 'Goossens' four times with one selected, Trips column has multiple entries labeled '002 Dave smith Small truck Z3 5 stops' with two selected, and Drivers column lists 'Dave Smith' multiple times with two selected. Below are summaries of selected trips (2) and drivers (2) with tags showing '002' and 'Dave Smith'. Buttons for 'Cancel' and 'Assign Drivers' are at the bottom.
Map interface showing a delivery route with 12 selected stops, highlighted in blue, alongside driver schedules for the week.
Plan in the blink of an eye

Smart Planning Tools

Easy to use automation tools
Plan dynamic or fixed routes
Make last-minute adjustments
Easy customization

Advanced Routing Algorithm

Plan with historic traffic data
Fine-tune after optimization
Include any constraint like capacities, time windows, driving times, tags and others.
Diagram showing parameters used in route optimization. Vehicle Parameters include Cost, Speed, Shift, and Tags. Delivery Parameters include Time windows, Size, Tags, and Service time. These connect to General Parameters: Minimize vehicles, Deliver as fast as possible, and Balance amongst drivers. These feed into an icon leading to Optimized Routes.
Smartphone screen showing a delivery tracking app with details for David Smith at Veldstraat 1, 9000 Ghent; status is 'Stop is completed' with delivery ID DR49098024 marked completed, scheduled time 13:10, ETA 13:14, and completed time 13:12; options to add comment or picture; lists items labeled 'Box' for drop and 'New box' for pickup, with buttons to abort or complete the delivery.
Simplistically sophisticated

Always-Connected Driver App

User-friendly
Real-time updates
Increase communication and traceability
Never lose sight of your deliveries

Monitor Your Deliveries

Monitor your operations accurately
Check what might be going wrong
Proactively solve issues
Dashboard displaying trip statuses: 23 completed, 12 in progress, 3 delayed, 2 aborted, with actions required for two drivers.
Map showing a delivery route with a blue line from a start location marked by a navigation arrow to an endpoint marked by a location pin. A sidebar displays delivery status updates with a driver photo named David and messages indicating he is on his way, expected in 16 minutes, with prior updates labeled 2 hours ago, a day ago, and 2 days ago.
Improve your customer experience

Accurate Tracking and Automated Notifications

Know where your drivers are
Keep your customers up-to-date with ETA notifications
Provide a real-time track and trace
Learn what can be improved

Keep an Eye on Your KPIs

Know what went well and what you can improve
Have the right data to report on
Keep your management up to date
Dashboard showing logistics metrics including total stops (52), trips (2), average stops per trip (43), average stops per hour (9), and average trip duration (4 hours 32 minutes). Bar charts display stops per status and trips per status over June, July, and August 2025 with categories color-coded. Three pie charts represent planning performance, delivery performance, and driver performance with segments in different colors.
Learn More About Our Software
DISCOVER OUR FEATURES
Ready to Deliver Smarter?
GET A FREE TRIAL